Properties and charts of pure substances
Properties of pure substances
Now that we have seen how to calculate the energies put into play in the different processes and what are the reference processes, some reminders on the properties of the working fluids are necessary. They will allow us to understand how these properties can be represented graphically in thermodynamic charts, and to learn how to use one of them, the (h, ln (P)) chart. We can then plot the cycles of the thermal machines that interest us.
Brief reminders on the properties of pure substances
To be able to understand how thermal machines work, it is essential to have a minimum of knowledge about the properties of the fluids which pass through them.
Let us recall that a pure substance can be in one or more of the three phases: solid, liquid or gaseous.
A phase is a continuous medium having the following three properties:
it is homogeneous (which implies a uniform temperature);
speed in each point is zero in a suitable reference frame;
it is subject to no external force at distance (uniform pressure).
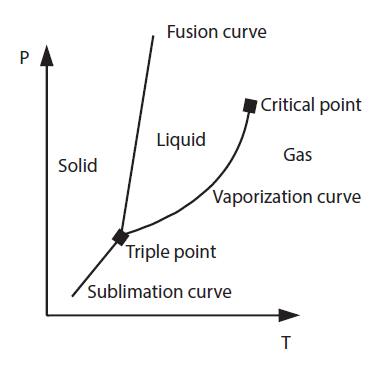
When a given mass of a pure substance is present in a single phase, its state is defined by two variables, for example its pressure and temperature. In the (P, T) plane, the three phases correspond to three areas, separated by three saturation curves (sublimation, vaporization and fusion) joining at the triple point T (Figure 3.1).
When heating a solid at a well chosen constant pressure, it turns into liquid, and we talk of fusion. This is how heated ice turns into liquid water.
If we continue to provide heat, the liquid turns to vapor, and we talk of vaporization.
So if you boil water in a pan, it evaporates and the amount of water left in the pan gradually decreases.
The phenomenon of vaporization and its opposite, condensation, play a fundamental role in the cycles of steam power plants and refrigeration installations. During these processes, the fluid is said to be in liquid-vapor equilibrium.
The temperature at which the liquid-vapor equilibrium takes place is an increasing function of the pressure exerted on the substance in question.
It remains constant as long as the vaporization is not complete. We call the law of saturation pressure the relation which gives the saturation pressure of a fluid as a function of temperature.
There is a pressure and temperature limit beyond which the liquid-vapor equilibrium zone disappears. We are talking about critical pressure and temperature.
In the (P, T) plane, the critical point T represents the state where the pure vapor phase has the same properties as the pure liquid phase.
At higher temperatures and pressures, called supercritical, it is not possible to observe a separation between the liquid and gaseous phases: the border which separates the liquid and vapor phases disappears at the critical point.
Saturation pressure law
For the phase change to happen, it is necessary to provide or absorb energy, called latent heat of change of state. During the vaporization process, there are significant variations in the specific volume, vapor being about 600 to 1000 times less dense than the liquid. This change in specific volume occurs at constant pressure and temperature.
For example, the figure below presents the law of saturation pressure Psat (T) of water, below 100 °C, saturation temperature of water at 1 atm, i.e. say about 1 bar.

It shows that the saturation pressure of water at room temperature is very small. At 20 °C, it is around 0.025 bar.
In the condenser of a steam plant, we try to condense the steam coming out of the turbine at the lowest possible temperature in order to increase the efficiency of the cycle. The condenser coolant is usually ambient air or river water, which are at low temperatures, close to 10 °C in mid-season to fix ideas. The condensing temperature of the water in the condenser is therefore as low as possible, and it operates at a very low pressure, much lower than the atmospheric.
The figure below is an enlargement of the saturation pressure law of R134a, between -18 °C and 50 °C.
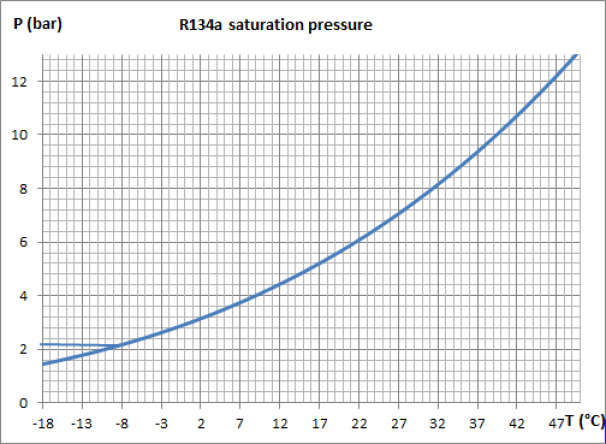
Let us examine its implications in terms of the value of the evaporation and condensation pressures of the working fluid of a vapor compression refrigeration installation where it is assumed that the cold enclosure is at the temperature Tce = - 8 °C, and ambient air at Ta = 35 °C.
The curve in Figure 3.3 shows that, if this fluid is used as a refrigerant, the evaporation pressure must be less than approximately 2.1 bar for the evaporation to take place at a temperature Tevap below - 8 °C so that the cold enclosure can transfer heat to the fluid. At the condenser, the pressure must be greater than 8.8 bar so that the condensation temperature Tcond is greater than 35 °C and that the cycle can be cooled by exchange with the ambient air.
A comparison of the condensation pressures of water and R134a, for example at a temperature of 20 °C, shows that the saturation pressures vary greatly depending on the thermodynamic fluid chosen, as illustrated by the curves in the figure below.
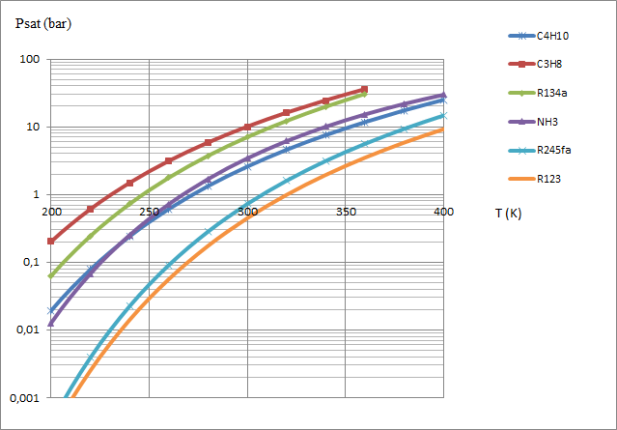
For a given application, the saturation pressure law is one of the criteria for selecting the working fluid.
In practice, moreover, there must be a sufficient temperature difference between the working fluid and the sources with which it exchanges heat, so that the evaporation pressure is even lower, and the condensation pressure higher.
Characterization of the state of a fluid
A fluid can be present in one or more phases.
If it is single phase and that we consider a small particle of fluid, its state can be defined by two quantities like its pressure P, its temperature T, its mass volume v, or its mass internal energy u or its mass enthalpy h.
These are the variables we will use most often.
Please note that pressures will generally be expressed in bar and not in Pascal, and temperatures in Kelvin by default and in °C otherwise.
At liquid-vapor equilibrium, when the fluid is two-phase, the pressure and the temperature are no longer independent.
The state of the small particle of fluid can then be defined by a quantity like its pressure P or its temperature T, as well as:
- either its vapor quality x;
- or its mass volume v, its internal mass energy u or its mass enthalpy h.
Vapor quality
In the vapor-liquid equilibrium zone, the fluid is present in both liquid and vapor phases. In this central zone, isobars and isotherms are combined, the liquid-vapor change taking place at constant temperature and pressure. The composition of the mixture is defined by its quality x, ratio of the mass of vapor mg to the total mass (mg plus the mass of liquid ml). Index g refers to the gas phase, and l to the liquid.

Enthalpy of vaporization
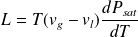
The length of the vaporization line gives the enthalpy (or heat) of vaporization L for the fluid conditions considered P and T.
hg - hl = L
L is a decreasing function of temperature, zero for T above the critical temperature. An approximate formula due to Clapeyron allows us to estimate L from the saturation pressure law:
Examples of practical use of phase changes
Let us give some examples illustrating either the practical use of phase changes, or the constraints induced by the presence of a liquid-vapor equilibrium:
When adding ice cubes to a lukewarm drink, we provide heat which melts them, which cools it. As the latent heat of fusion of ice is much larger than the heat capacity of the drink, we get the desired cooling effect without bringing too much water dilution;
To transport methane over long distances by sea, it is liquefied at a temperature of - 160 °C, reducing its specific volume 600 times with respect to gas. It is thus possible to maintain atmospheric pressure in the tanks of the Liquefied Natural Gas LNG ship. Although these tanks are very well insulated, you cannot avoid some heat exchange with the surroundings, which has the effect of vaporizing a small amount of gas which is used for propulsion;
In contrast, butane or propane gas distributed for culinary purposes is confined in a liquid state at room temperature in thick metal cylinders, in order to resist the inside pressure of a few tens of bar (or hundreds of psi);
All cooking done in boiling water takes place at 100 °C if the pressure is equal to 1 atmosphere, and this irrespective of the thermal heat supplied to the cooking. Thus we can define the precise duration for cooking a recipe, for example, a boiled egg;
The principle of the pressure cooker is to overcome this limit of 100 °C by doing the cooking in a chamber at a pressure exceeding 1 atm. It can reach 110 °C and 120 °C, in order to cook food more quickly;
An example of condensation is that which is deposited on cold surfaces in contact with moist air, like mist on a window, or the morning dew on leaves.
Deepening on water vapor
The interaction of water vapor with air is a complex phenomenon that deserves some explanation.
In this section, we propose to study water vapor in greater depth, as it is often overlooked. The choice of water is justified because it is undoubtedly the only condensable working fluid of which everyone has concrete knowledge.
Of the three phases of water, vapor is by far the least understood because it is invisible and odorless. Everyone now knows what ice or liquid water is, having had many experiences with it, but vapor is much less well perceived, to the point that some may be led to doubt its existence or at least to have a misconception of it, which will handicap their understanding of thermal machines with condensable fluid.
The difficulty is that the water vapor does not manifest itself in a way that is directly perceptible by our senses, except by touching it when we receive a jet of vapor on the skin. It is most often indirectly that we perceive water vapor, because of the manifestations of its interactions with the air and the cold surfaces around us.
A few explanations of these phenomena will allow you to get a more accurate idea of what water vapor is, and therefore the other vapors that we will discuss.
Water vapor is very present in our daily environment, under the short name of vapor.
Dieticians praise the virtues of steaming, which is carried out by placing in a saucepan closed by a lid a basket slightly raised from the bottom, in which the food to be cooked is placed, above a small quantity of water. During cooking, the water comes to a boil, and the resulting steam fills the available space in the pot, partly condenses on the pot, and cooks food soaked in it. Both liquid and vapor phases are present in the pan, but since it is closed and the vapor is invisible, it cannot be perceived directly.
The steam is also manifested during cooking in a pressure cooker or pressure cooker, by the jet which passes through the nozzle and which is partially visible. We will come back to this apparent paradox a little later.
Steam is commonly used for ironing, as the soles of modern irons have holes for steaming steam to moisten clothes to be hot-moistened, improving the treatment without risking leaving marks.
Do-it-yourselfers who have renovated homes may have had to use a stripper to remove the wallpaper from the walls, which greatly facilitates the task, the steam being diffused again through holes in the sole of the device.
Hammam enthusiasts appreciate baths taken in an atmosphere saturated with humidity brought by steam injected into the ambient air, which stimulates sweating.
Finally, in winter, the vapor present in the indoor air of homes causes condensation on the cold walls which can result in disorders such as the development of molds.
Dry air is a mixture of oxygen (23% by mass), nitrogen (76% by mass) and certain gases (argon, CO2) in small proportions (about 1% by mass), but dry air almost never exists: it almost always includes water, in gaseous, liquid or ice crystals form.
The thermodynamics of moist mixtures make it possible to study the properties of real air, which always includes a part of humidity.
When we are interested in a moist mixture, we are dealing with a mixture of gases which do not condense, which is called dry gas, and water, which can condense. Everything happens in a way as if the moist mixture were a mixture of two substances: dry gas, the composition of which is unchanging, and water, capable of occurring in one or more phases.
Two quantities are commonly used to characterize the humidity of a moist mixture: the specific humidity w and the relative humidity ε, more commonly used by the general public.
We call specific or absolute humidity w the ratio of the mass of water contained in a given volume of moist mixture to the mass of dry gas contained in this same volume.
The curve in this figure shows the value of the specific humidity of air saturated with water expressed in grams of water per kilogram of dry air, which varies considerably depending on the temperature: at 20 °C, the saturated air contains about 15 g of water and at 60 °C about ten times more. When, at a given pressure, the temperature drops below the water saturation temperature (given by the curve in the figure previouslys shown), the water vapor in excess of the specific humidity of saturated air begins to condense in the form of mist or on the cold wall which delimits the system if it exists. To be more precise, this is what happens on the physical plane: the (so-called partial) pressure of water in the air cannot exceed the saturation pressure at a given temperature. Recall that the partial pressure Pi of a constituent is the pressure that this constituent would exert if it occupied alone the volume V of the mixture, its temperature being equal to that of the mixture. Mathematically, this is expressed by the relation Pi = xi P, P being the total pressure and xi the molar fraction of the constituent i. For water, we therefore have: PH2O = xH2O P. The condensation condition is therefore written PH2O = xH2O P ≤ Psat(T), or:
| 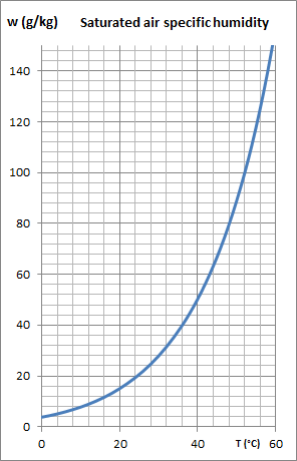 Specific humidity of saturated air |
The relative humidity ε briefly introduced above is precisely defined as the ratio of the partial pressure of water to its saturated vapor pressure:

Relative humidity is 1 (or 100%) when the vapor begins to condense. Otherwise, it is less than 1.
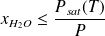
The figure below shows the so-called psychrometric diagram of humid air, on which the curves of relative iso-humidity appear, from 10% to 10%, the upper curve corresponding to saturation. In this diagram, the ambient temperature (called dry) is plotted on the abscissa, and the specific humidity w on the ordinate.
The mass of vapor contained in the air results in a partial pressure of water vapor. If, at room temperature, this pressure exceeds that given by the saturation curve in Figure 3.2, there is condensation of the excess vapor fraction.
Let us take the example of the pressure cooker that we mentioned earlier. In normal operation, its interior temperature is close to 110 °C.
The steam which escapes at high temperature from the security valve gradually cools in contact with the ambient air with which it mixes. Up to one or two centimeters above the nozzle, the jet contains only invisible vapor. Then the water-saturated mixture begins to condense, forming a mist of perfectly visible microdroplets of water. This mist then evaporates when it mixes with dry air away from the pressure cooker.
The same phenomenon appears in the exhaust of the turbojets of planes flying at high altitude due to the fact that the gases burned by the combustion of kerosene contain water vapor. It explains the white streaks that signal their passage and disappear after a certain time, the condensed water vaporizing when the saturation conditions are no longer met.
The formation of clouds follows the same logic. It results from the cooling of a volume of air until the condensation of part of its water vapor. If the cooling process occurs on the ground (by contact with a cold surface, for example), fog is forming.
The condensation that appears in winter on the windows of a home or vehicle also comes from crossing the saturation threshold of humid air in the immediate vicinity of the cold surface. The morning dew on the plants reflects the same phenomenon.
Water in humid air can also condense directly to a solid state if the temperature is low enough, which is why snow and frost form in refrigerators. Snow cannons used by ski resorts use this phenomenon.
We hope this small section has convinced you of the existence and materiality of water vapor, although it is usually not directly noticeable. It is indeed fundamental that you have no doubts about it if you want to study thermodynamic cycles with condensable fluid under good conditions.
Model of ideal gases
An ideal gas is a gas whose internal energy and enthalpy only depend on temperature, which simplifies its modeling: its equation of state is Pv = rT.
From a microscopic description of the phenomena, the kinetic theory of gases makes it possible to find macroscopic properties such as volume, enthalpy, etc.
The simplest model is one where it is assumed that the size of the molecules and the interactions between them are negligible. The theory of ideal gases is based on the assumption that the molecules of the gas behave like hard spheres of negligible size, that is to say undeformable, which collide with each other and rebound elastically, without any interaction between them (Figure below).

In an ideal gas, it is thus considered that the molecules do not have their own volume and only have kinetic energy due to their speed of movement. This model is mainly applied to gases under low pressure, far from their saturation curve.
This model leads to the ideal gas law: Pv = rT, in which T is expressed in Kelvin. It can be shown that, if Cp and Cv are constant (perfect gas):
Δu = Cv (T-T0)
Δh = Cp (T- T0)
Cp and Cv are the mass thermal capacities (or specific heats) at constant pressure and volume, and T0 a reference temperature.
Many thermodynamic fluids in the vapor phase can be likened to ideal gases, in a wide range of temperatures and pressures. In particular, the temperature-pressure combination must deviate sufficiently from the possible condensation zone (that is to say that the pressure is not "too" high, nor the temperature "too" low). Such conditions are commonly achieved for so-called "permanent" gases such as, at ambient pressure and temperature, hydrogen, oxygen, nitrogen, the oxygen-nitrogen mixture which constitutes dry air.
The ideal gas model assumes that the heat capacities Cp and Cv are constant, which is only strictly verified for monoatomic gases (which do not have any mode of rotation or molecular vibration). This hypothesis is all the less satisfactory since the gas molecule has more atoms (and therefore possible vibrational modes).
An ideal gas differs from a perfect gas in that its thermal capacities are not constant, but only depend on the temperature.
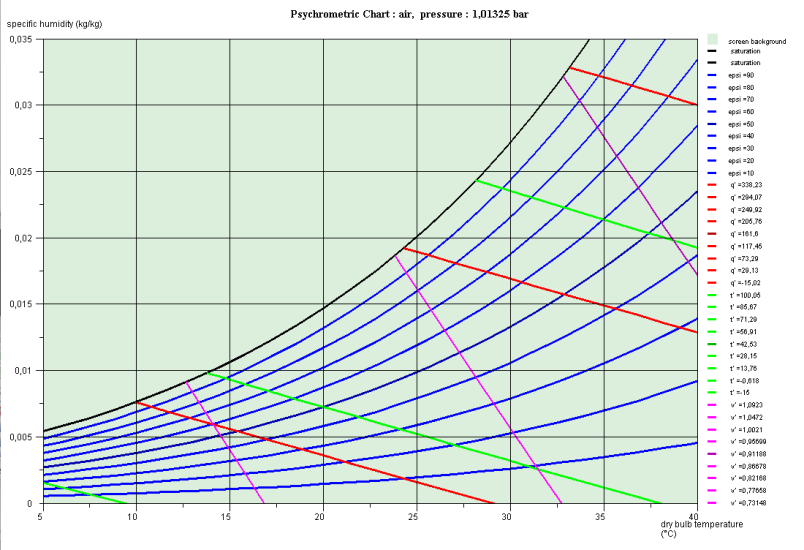
The figure below gives the evolutions of the specific heat Cp for some typical mono-, bi- and tri-atomic gases. The value of the molar Cp is given on the ordinate, and the temperatures appear on the abscissa. The dependence of Cp on the temperature is clearly visible.
An ideal gas still follows the law Pv = rT, and u and h are still independent of pressure, but their expression is more complicated than a linear function of temperature.
One of the remarkable characteristics of ideal gases is that a mixture of ideal gases behaves itself as an ideal gas. This is called the Dalton law. It states that the properties of the mixture are very easily calculated from those of the gases which compose it and their molar fractions xi or their mass fractions yi.
Recall that the molar fraction xi of a constituent is by definition the ratio of the number of moles of this constituent to the total number of moles in the mixture, and that the mass fraction yi of a constituent is by definition the ratio of the mass of this constituent to the total mass of the mixture.
 and
and

 and
and

Choice of state variables to consider
Now that we have introduced the First Law, established its equation for open systems and showed just how it applies to the four basic changes experienced by fluids in machines that interest us, we can discuss the advantages and disadvantages of different state variables that one can consider using.
We have seen that several sets of state variables can be used to characterize a thermodynamic system. The most "natural" are temperature, pressure and volume, but there are others, like the enthalpy defined in the previous course, and secondly they are not fully satisfactory for of our goals, as we shall show.
Pressure P is essential, both because it directly determines the mechanical stress in components, and because, as we have seen, the reference process for fluid heating and cooling is isobaric.
Temperature T is also essential, but, unlike its predecessor, the isothermic process does not correspond to any process that concerns us.
Volume v intervenes very little in the analysis of interest, even in a closed system, because volume varies due to the existence of movable walls. In fact, its main practical interest is in the calculation of the flow section sizes.
Enthalpy h is a fundamental variable too, because it is directly related to energy exchanges that take place in the machines. For a perfect gas, it is a linear function of temperature, very easily deduced, and in the liquid-vapor equilibrium zone, it provides additional information on the quality. Finally, remember that the isenthalpic process is the reference process for an expansion without work.
The analysis of processes undergone by fluids during compression and expansion with work showed that their reference process is reversible adiabatic. We indicated that for a perfect gas it follows law
 = Const.
Let us note, but incidentally given our focus for simplicity, that this law is that of the isentrope. Entropy s is also a state function widely used in thermodynamics, especially because the isentrope is the reference process for compression and expansion.
Self assesment activities
The different states of fluids and gas modeling must be well understood before studying their representation in diagrams.
These self-assessment activities will allow you to test your knowledge on these topics:
Solid, liquid and gas phases, gfe
Thermodynamic charts
Thermodynamic systems which we consider can be characterized by two state variables; they are called bivariant. This means that their thermodynamic properties can be plotted in a plane in the form of a thermodynamic chart.
By highlighting the reference processes of changes undergone by fluids and allowing us to calculate them, at least approximately, charts are among the basic tools of thermodynamics. Their interest is twofold:
to help plot the cycles;
to facilitate the estimation of the thermodynamic state of the various cycle points.
Because of the possibilities offered by software packages for calculating fluid properties that are increasingly common, the second interest tends to decline while the former retains its relevance. The display on a chart of a cycle calculated using a computerized tool helps ensure that it does not contain an abnormal point due to an error when entering data.
A chart is presented in a graphical map with the plot of a number of remarkable curves, including families of state function iso-values.
Different types of charts
In practical terms, the main processes that take place in industrial processes involving pure fluids are, as we have seen, compression, expansion, heat exchange and throttling.
It is clear that the temperature T, pressure P and the steam quality x are state variables whose knowledge is necessary to study these processes and design equipment.
The above remarks show that the enthalpy h is also very important. Finally, knowledge of the specific volume v is necessary to size the pipes, since it allows us to convert mass flow rate into volume rate.
In conclusion, the most interesting quantities are in practice T, P, h, and additional information on x and v may be necessary. So the abscissas and ordinates of the charts that we can consider should be chosen among them (recall that we exclude here the entropy).
The pair (T, h) is rarely retained because the isobaric and reversible adiabatic are represented by curves with inflection points that make their use difficult. In addition, variations of T and h are proportional when the fluid follows the ideal gas law.
Except for permanent gases, i.e. whose state is very far from their saturation conditions, the pair (T, P) is insufficient, because T and P are bound by the saturation law in the liquid-vapor equilibrium zone. It would however be quite suitable to represent gas turbine cycles.
For our purposes, as part of this lightweight educational presentation, these remarks are sufficient to allow us to conclude that the pair (P, h) is a set of state variables of particular interest. It is increasingly used, generally with a logarithmic scale for pressures. Its widespread use has been promoted by refrigeration engineers, and we will study it further.
Finally, the pair (P, v), Clapeyron chart, has a certain educational value, especially for the study of changes in closed systems. Its main drawback is its low visibility, the area of vapors being reduced and energy functions not appearing directly.
In conclusion, as this lightweight educational presentation does not include entropy, the pair (P, h) appears the best suited.
(h, ln(P)) chart
In the (h, ln(P)) chart (Figure below) the enthalpy is the abscissa and pressure the ordinate, usually on a logarithmic scale.
Note that the base logarithm b of a number is the power to which it is necessary to raise the base b to obtain this number: the logarithm of one hundred in base ten is 2, because
 . Two main families of logarithms are commonly used: the decimal logarithm defined above, and the natural logarithm, which is the inverse function of the exponential, and for which b = exp (1) = 2.718281828. This is the one we will use, and we will note it ln for this reason.
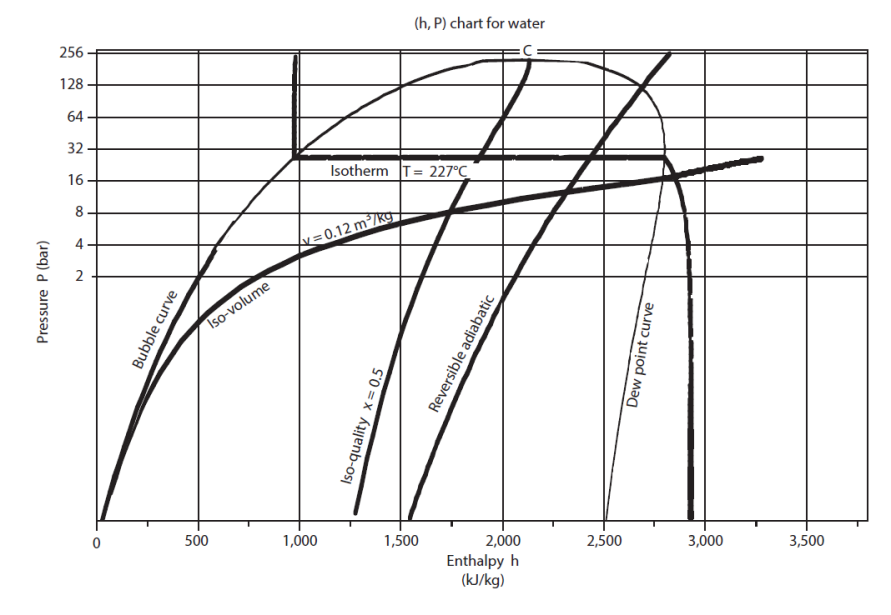
The saturation curve separates the plan in several zones. Its summit is the critical point C, the left side, bottom, representing the saturated liquid (bubble curve), and its right side, the saturated vapor (dew point curve). Under this curve is the two-phase liquid-vapor equilibrium zone, and in the rest of the plan, that of simple fluid.
Remember, the critical point represents the state where the pure vapor phase has the same properties as the pure liquid phase.
For this chart to be used, it is equipped with reversible adiabatic curves, isotherms, isovolumes, and in the mixed zone, iso-quality curves.
In the "liquid" zone on the left of the chart, isotherms have a very strong negative slope: the compression of a liquid involves a very small work.
In the two-phase zone, pressure and temperature are related by the law of saturation pressure, and isotherms are horizontal. The enthalpy increases enormously, corresponding to the heat of vaporization that must be supplied to the fluid.
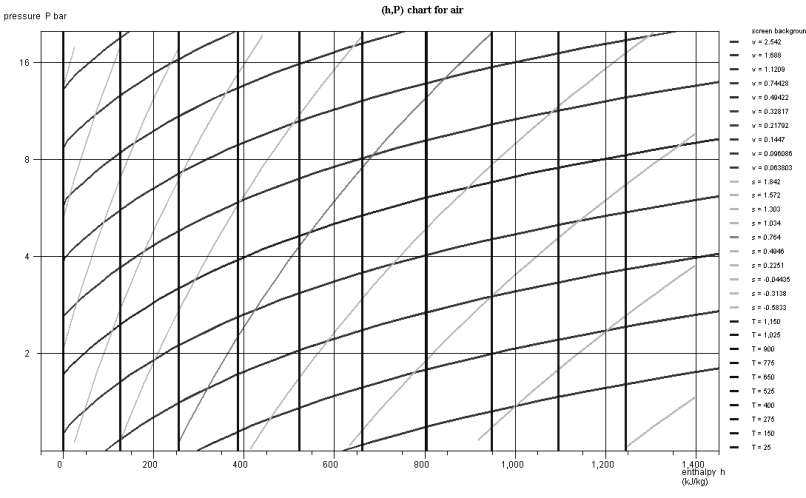
In the zone to the right of the saturation curve, the isotherms are curved downward, close to vertical for low pressure values. Indeed, the behavior of vapor then approaches that of an ideal gas, whose enthalpy depends only on temperature. The figure below shows a diagram (h, ln (P)) of ideal gas.
Heating or cooling (isobars) are reflected in this chart by a horizontal segment, an expansion without work (isenthalpic) by a vertical segment.
A reversible adiabatic is an upward curve with a slope equal to the inverse of specific volume. They are much less inclined in the vapor zone than in the liquid zone.
Iso-quality curves are contained inside the liquid-vapor equilibrium zone. They intersect at the critical point.
Iso-volume curves converge in the liquid zone where they become independent of pressure.
In the chart in the figure above which corresponds to air, modeled as an ideal gas, the isotherms are vertical, the isovolumes and the reversible adiabatic, steeper curves being with downward concavity. If we plot the diagram in non-logarithmic coordinates (Figure below), the isovolumes are straight lines, and the concavity of the reversible adiabatic is oriented upwards.

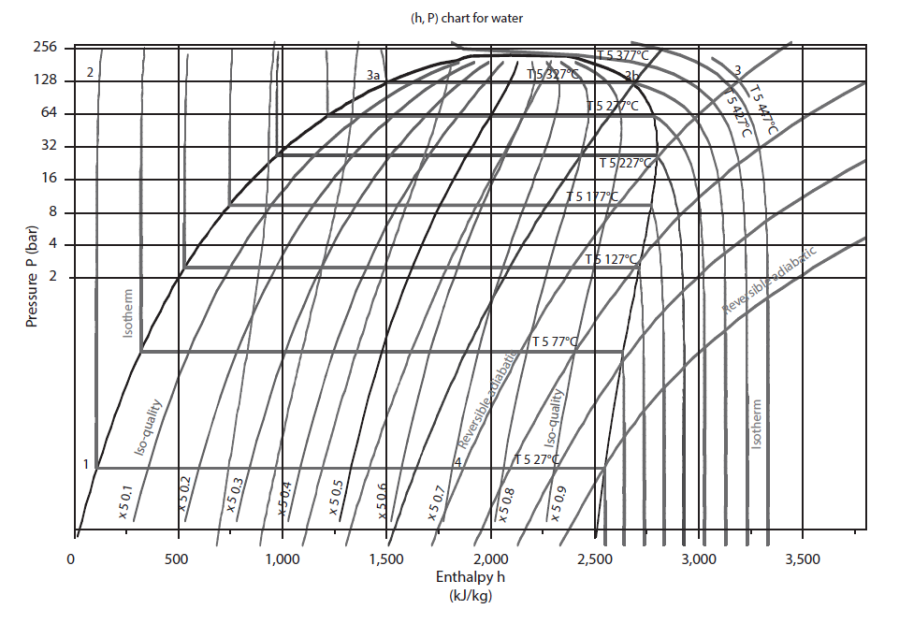
The figure below shows the (h, ln (P)) chart of water. The zero of the enthalpies is in the liquid state on the saturation curve at 0 °C.
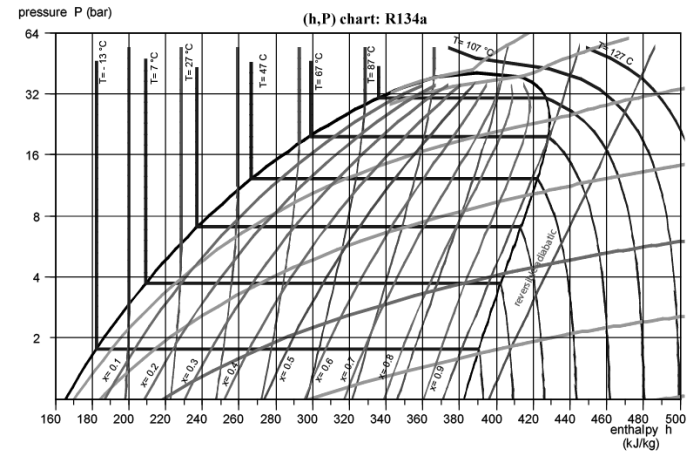
The figure below shows the (h, ln (P)) chart of for R134a refrigerant.
Placing points in a chart is not difficult, but requires attention and a little experience, since the known state variables are not the same depending on the case. It is therefore necessary to know how to find the appropriate iso-value curves and interpolate between them.
Self-assessment activities
These self-assessment activities will allow you to test your knowledge on these topics:
(h, ln (P)) chart of a vapor, gfe
(h, ln (P)) chart of a gas, gfe
Zones of a (h, ln (P)) condensable vapor chart, ddi
Curves of a (h, ln (P)) condensable vapor chart, ddi
Placement of points in a (h, ln (P)) condensable vapor chart, ddi
