Basic Thermoptim notions
General
This page presents the basic notions that should be known before using Thermoptim.
Thermoptim provides a modeling environment integrating in a deeply interconnected way a diagram editor / synoptic screen, interactive charts, simulation functions and an optimization method.
This tool was created to facilitate and secure the modeling of energy conversion technologies.
This page presents the main concepts that it is important to know to be able to work with Thermoptim. However, to take full advantage of the possibilities of the software package, we recommend that you also consult the reference manuals and the getting started examples available in the documentation.
Thermoptim is composed of a core comprising the main elements, which already make it possible to model many energy systems but can be extended to represent additional elements not available, making this environment highly customizable
Three categories of extensions can be made:
substances, to add fluids not available in the core;
components representing specific energy technologies, such as solar collectors or fuel cells;
and drivers, which are small programs that take control of Thermoptim and thus make it possible to control the calculations it performs.
To refer to these extensions, we talk about external classes, a class representing an element of Java code, and the external adjective indicating that they are external to the core.
To fully understand how Thermoptim works, three basic concepts must be present in mind:
substances, which make it possible to characterize the different fluids involved
points, which represent an elementary particle of matter
processes, which are used to determine the processes undergone by the fluids in the various components, such as compression, expansion or heating
Substances
To represent the different fluids that flow through the systems studied, Thermoptim defines four types of substances:.
Gases
Thermoptim includes around twenty pure gases.
We can define as many compound gases as desired, obtained by mixing the pure gases available.
Compound gases are divided into two categories:
protected gases whose composition cannot be modified by a user
the others, called unprotected.
The reason for this distinction is simply to prevent a modeling error from changing the composition of a known gas, such as that of air or natural gas.
The properties of the gases are based on the ideal gas model: the law Pv = rT and a development of the thermal capacity Cp of the gas as a function of the temperature.
The perfect gas corresponds to the particular case where Cp is a constant.
Of course, this type of model is only valid to represent the properties of the fluid far from its liquid-vapor equilibrium curve.
Condensable vapors
The third type of substance complements the two previous ones: twenty condensable vapors that cannot be mixed. Thermoptim cannot calculate the properties of a vapor mixture in the general case.
Some substances, like water, appear as both pure gases and condensable vapors. These are two distinct models selected based on the problem to be solved. The names of pure gases always include their chemical formula, particularly used in combustion calculations. Meanwhile, vapors are typically referred to by their common names. For instance, water is denoted as "H2O" when considered as an ideal gas, and referred to as "water" when modeled as a condensable vapor .
External substances
External subsances are defined outside of the Thermoptim core, hence their name.
They can either be simple substances, entirely calculated in the external classes of Thermoptim, or else mixtures, whose calculation can be carried out in specific software, coupled with Thermoptim, such as CTP Lib.
For a Thermoptim user, a substance is simply characterized by its name
Substance selection screen
This figure shows the substance selection screen, with the list of condensable vapours deployed. | 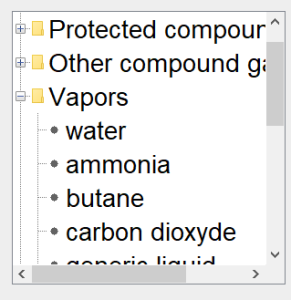 |
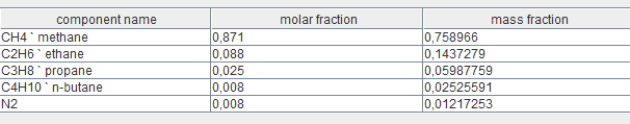
This figure illustrates the screen for defining the composition of a compound gas, specifically the natural gas from the Montoir de Bretagne LNG terminal. It displays the names of the individual gases that constitute it, along with their respective molar and mass fractions.
Points
Thermoptim also defines points, which represent a small amount of fluid, whose thermodynamic state can be calculated in an open or closed system, when pressure and temperature are known, for example.
This figure displays the interface for a point, which can be computed in either an open or closed system. Additionally, it can be utilized to determine the properties of moist gases, represented as a mixture of water and dry gas considered ideal. To define a point, you must assign it a name (e.g., 3a), enter the associated substance's name manually, or select it from the provided lists that appear when double-clicking in the name field. | 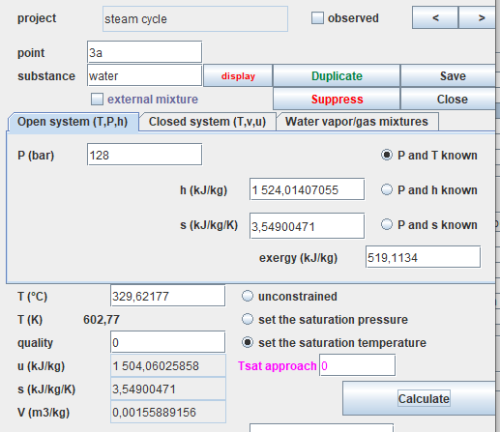 |
It is imperative to define an adequate number of state variables, typically pressure and temperature, ensuring that the chosen calculation method (in this case, known P and T) is accurate.
When dealing with a condensable vapor, it is feasible to establish either the saturation temperature with known pressure or the saturation pressure with known temperature. It is then imperative to specify the quality, set here as equal to 0.
Subsequently, the point can be calculated by clicking on the 'Calculate' button.
Processes
Processes correspond to thermodynamic evolutions experienced by a substance between two states. A process, therefore, associates two points as defined previously (an inlet and an outlet point). Additionally, it specifies the mass flow rate involved, enabling the determination of the energy variation throughout the process.
The most common processes have been modeled and are directly accessible in the core.
Given the fluid's state at the process inlet, Thermoptim can then address either the direct or reverse problem. In the first case, where the characteristics of the process are known, it calculates the state at the end of the evolution, determines the energies involved, and updates the downstream point. In the second case, it identifies the parameter values of the process to ensure that the chosen evolution results in the defined state of the downstream point.
This figure displays the screen for an expansion process, illustrating a steam turbine. Screens for other processes follow a similar structure.
In the upper-left corner, you'll find the process name (in this case, turbine), its type (expansion here), the energy type automating energy balance calculations (useful here), and an option to specify or omit the flow through the process. If not specified, it is automatically propagated from the process immediately upstream.
On the left side, you'll find a summary of the thermodynamic state details for the upstream and downstream points. Clicking the 'Show' button opens the screen for the corresponding point. In the upper right, you'll see navigation buttons along with options to open, close, and calculate the process.
In the lower right section, you'll find configuration options specific to each process. Compressions and expansions can be calculated in open or closed systems, with adiabatic or non-adiabatic references, and isentropic or polytropic models. You can set or calculate the compression ratio. In this case, we've opted for an adiabatic expansion with an isentropic efficiency of 0.85. The downstream point calculation takes into account the known efficiency.
Since a point does not allow specifying the flow involved, it may be necessary to create specific processes, known as process-points.
A process-point connects a point with itself and specifies the mass flow rate to be taken into account. It corresponds technologically to a small pipe and allows, in particular, the representation of fluid inputs or outputs.
Other features
Nodes
The fluids involved traverse the machines, forming more or less complex networks that must be described. Processes correspond to a part of these circuits. They are complemented by three types of nodes, which describe the elements of the network where mixtures and divisions of fluids take place. In a node, several fluid branches are connected together to form a single stream.
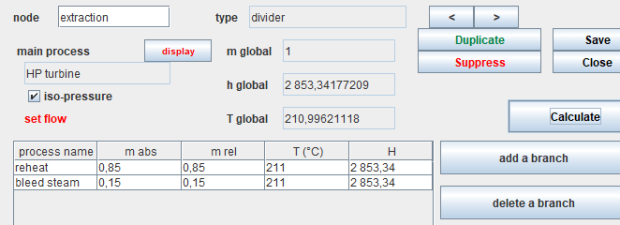
Three types of nodes exist in the Thermoptim core: mixers, dividers and phase separators for two-phase fluids.
The simulator
This figure displays the Thermoptim simulator screen, providing access to the list of points at the top left and the list of processes just below. The list of nodes appears at the bottom left, but in this example, there are none. Heat exchangers can also be defined, although we won't delve into them at this time. A double-click on one of the lines opens the selected point or process screen.
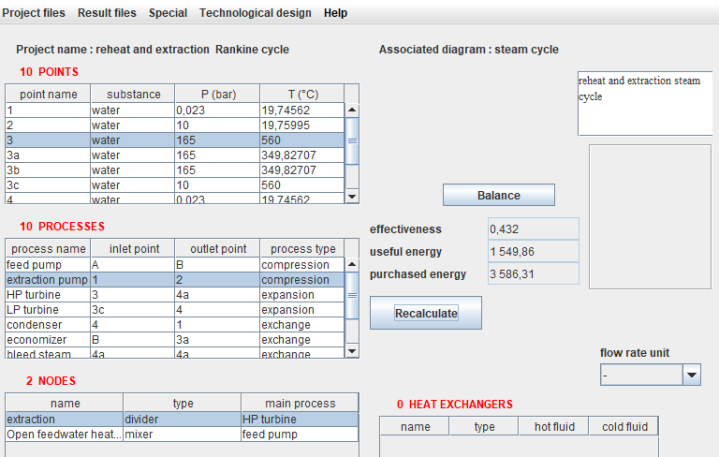
Diagram editor
This figure shows the screen of Thermoptim's diagram editor, with an enlargement of the palette icons.
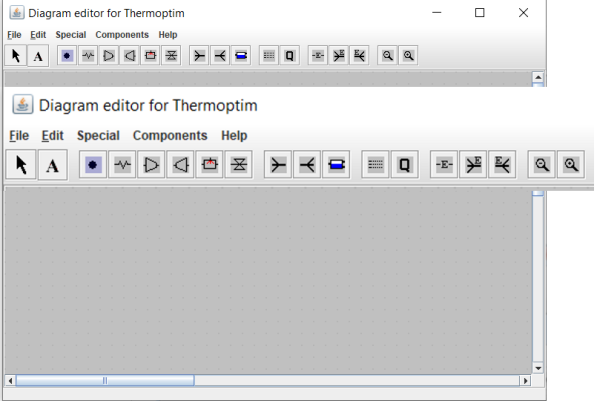
Except for the arrow on the left, which is used to return the mouse to its normal state, the icons from left to right allow you to select different components and place them on the working plane:
the "A" icon allows you to write a text
the processes of the core, including the process-point, heat exchange (heating or cooling of a fluid), compression, expansion with work, the combustion chamber and the isenthalpic throtling
the next block provides access to the three nodes: mixers, dividers and phase separators
the following icon irepresents the component providing the synthetic balance
the Q is used to represent a heat source, intended, primarily for educational purposes, illustrating that systems typically exchange heat with the outside
the subsequent block gives access to the three external components
finally, the last two icons enable you to zoom in or out the diagram

The various components are connected by thin black lines oriented in the direction of fluid circulation, indicating the state of the fluid.
A double-click on a process opens its screen, and double-clicking on an oriented link opens the corresponding point.
The blue links in this representation signify connections to external sources, and the cycle balance is displayed in a small block.
Charts
Access to thermodynamic charts is available through the "Interactive Charts" menu in the "Special" menu on the simulator screen.
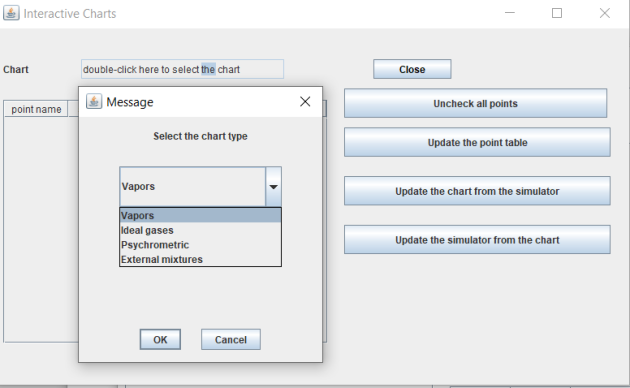
When you double-click on the line "double-click here to choose the chart," the list of available chart types is presented, allowing you to choose the desired one.
