Calculation of thermodynamic solar installations
Complex energy systems
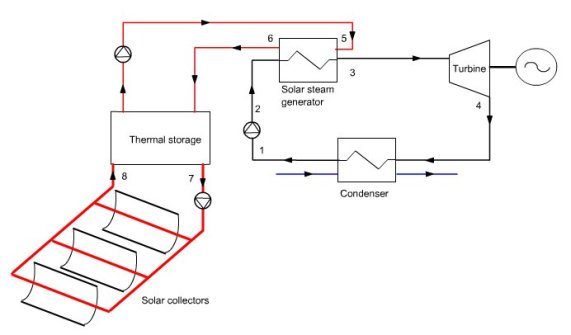
Solar facilities, even the most simple, are relatively complex and include at least one collection circuit, an energy distribution circuit, storage and various control systems (Figure below). In these, both the load (demand) and availabilities vary continuously.
Taking into account the variability of the solar resource
When trying to calculate the energy balance of a solar installation the main problems often stem from the variation of solar radiation. Indeed, analysis of the behavior of solar collectors, or system to which they are associated, can highlight different operating regimes that depend on incident solar radiation, transition from one regime to another being triggered by certain critical values called radiation thresholds.
When radiation intensity varies greatly, as is usually the case, the whole system frequently changes operation mode. In these circumstances it is not possible to determine a priori an average behavior of the entire facility that could be used to size it.
To calculate the energy balance of a solar system, it is necessary to have maximum information on the distribution of incoming solar power. Thus, one of the first problems to be solved is to correctly estimate the radiation received by solar collectors.
Simulation and simplified calculation methods
In order to take into account accurately the variation of the resource and the interactions of the different solar system components, most accurate methods rely on simulation programs (often called hourly), which calculate, for time steps generally of several minutes, plant performance, starting from the hourly radiation measured by national weather services.
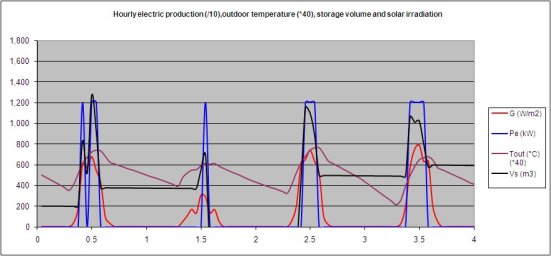
For example, Figure below shows the hourly simulation of the electricity production Pe of a thermodynamic solar plant over a period of four days, and variations of solar radiation G received by 1 m2 of solar collector, outside temperature Tout (x 40) and storage tank volume Vs. This figure shows that electricity production is not proportional to the sunlight received. It depends on many factors, such as tank volume, Tout, existing control system etc.
Hourly simulation has the advantage of being very precise and can be adapted to each particular case, but it also has several drawbacks:
it requires a good knowledge of simulation environments, which is beyond the reach of many solar energy users;
it calls for the development of calculation programs expensive to make and use;
it requires large data files.
For all these reasons, many researchers have attempted to develop simplified calculation methods, easy to use, even if their accuracy or generality is somewhat reduced.
Cumulative frequency curves (CFC) of solar irradiation
For this it is necessary to summarize in one way or another solar radiation weather data. The first idea that comes to mind is to use the average values published by national weather services.
However, they are established so that information on the power thresholds is lost, and their use can lead to large errors.
Some authors also proposed to set reference days, or typical days, during which the operation of the facility could be simulated. In this case, the difficulty lies in the selection criteria for typical days, and you never know how much you can rely on them.
The analysis of meteorological data required for calculations, and our fine simulation experience led us to choose a form of data presentation that emphasizes the phenomena of thresholds and nonlinearity: cumulative frequency curves (CFC) of solar irradiation received by a collecting surface. Based on work done in the 80s at the Centre for Energy Studies of the École des Mines de Paris (Gicquel, 1977, Bourges et al. 1990), the value of these curves and how to build and use them are explained below.
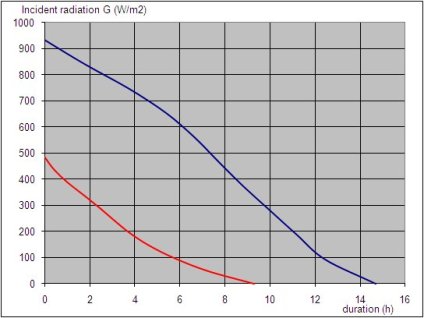
For example, in Figure below, in Ajaccio in July, the threshold of 600 W/m2 was exceeded on average 6 hours per day on a horizontal plane. The x-intercept corresponds to the average day duration for the period. The area bounded by the curve and the axes is none other than the daily average energy received over this period.
The area bounded by the curve and the axes is none other than the daily average energy over this period. In January (red curve), the abscissa of 6 h is a threshold slightly below 100 W/m2.
Modeling of the thermodynamic cycle
In most cases, the production of solar electricity by thermodynamic conversion uses concentration collectors. The experience of the last thirty years shows that four main technologies are used in practice to concentrate solar radiation in technical and economically viable conditions:
parabolic trough PT (Concentration 40-80), which are cylinders of parabolic cross section, that concentrate sunlight onto a straight tube;
concentrating linear Fresnel reflectors CLFR (Concentration 30): these use narrow rectangular plate mirrors to concentrate sunlight onto a fixed absorber consisting of a series of parallel tubes;
parabolic dish PD (Concentration 1,000-2,500), where the reflector is a paraboloid of revolution;
power towers PT or central tower plants (Concentration 200-700), in which thousands of tracking reflectors, called heliostats, redirect incoming solar radiation to an absorber at the top of a tower, allowing achievement of both high concentrations and high radiation fluxes.
Four thermodynamic cycles are now mostly considered for conversion to electricity:
Hirn (or Rankine) cycle for PT, CLFR and CT, or with flat plate collectors at high temperature (vacuum);
Brayton cycle for PD (micro GT) and CT (hot air cycles);
Stirling cycle for PD;
combined cycle, combining the first two, for PT or CLFR (ISCCS).
We refer you to the " Technology / Systems " section of this Portal for details on these cycles.
In addition, the thermodynamic cycle efficiency can be assumed constant or variable depending on the one hand on the condensation conditions, which often depend on ambient temperature, and secondly on temperature and flow of the fluid entering the boiler. If one wishes to know the performance of the thermodynamic cycle when its boundary conditions vary, it is necessary to model it in off-design mode, as explained in the "Methodological guides / Technological design and off-design operation" section of this portal: the steam cycle case study treated in section 6.2 provides an example of the type of model that should be built.
Documents available
Downloadable notes below will explain how:
In addition, a page simulating the path of the sun uses spherical trigonometry calculations presented in the first of these documents.
Furthermore, links below will allow you to access spreadsheets to:
Calculations of irradiation (CalculsSolaires.xls macro determines irradiation outside the atmosphere)
Work on CFCs and the usability curves (ExempleCFC.xls)
Estimate by a simplified method based on the CFC, monthly and annual production of an electro-solar plant (MethodeSimplifieeCFC_annee.xls)
Data files on CFCs are also offered:
You will find in the workbook DonneesCFC.xls CFC data on few stations in Europe. They provide values for 5 south inclined planes of slopes 0 °, 30 °, 45 °, 60 ° and 90 °
You will find in the workbook DonneesCFC_type2.xls data on CFC of some stations in southern France.
Sheets entitled "vertical" contain CFCs for all vertical planes between -90 ° (East) and +90 ° (West) in steps of 15 °, and in addition directions northeast, northwest and north
The sheets named "others" contain CFCs for all inclined planes from 0 to 75 ° tilt and -45 to +45 ° direction, in steps of 15 ° (and in addition for the south plane inclined to latitude).
Acknowledgements
We thank Prof.. B. Bourges, Ecole des Mines de Nantes, who kindly put at our disposal data on CFCs that are accessible from this page.
References
BOURGES B., European simplified methods for active solar system design, ISBN: 0792317165, Kluwer academic publishers, Dordrecht, The Netherlands, 1991.
GICQUEL R., "Cumulated frequencies Diagrams", Energie Solaire : conversion et applications. CNRS 1977 (Cargèse).
GICOUEL R., "Présentation statistique des données relatives à l'ensoleillement". Revue Internationale d'Héliotechnique - ler semestre 1977.
R. GICQUEL Method for evaluating the solar energy provided by a flat insolator. International Chemical Engineering, Vol. 17, n° 4, October 1977.
CRC_pa_9
