Introduction
It follows on from guided exploration S-M3-V8 which presented the cycle of a gas turbine where combustion was modeled by a simple exchange process.
Setting retained
The chosen setting is the same as that of the S-M3-V8 guided exploration. Let us recall the main elements.The gas turbine sucks air at 25 ° C and 1 bar, and compresses it to 16 bar in a 0.85 isentropic efficiency compressor.
Compressed air enters the combustion chamber burning natural gas, then the burnt gases are expanded in a 0.85 isentropic efficiency turbine.
The turbine inlet temperature is 1065 ° C and combustion is assumed to be perfect.
Reminders on combustion
In the Thermoptim-UNIT portal, you will find a summary presentation of the combustion chambers and a Diapason session on combustion.
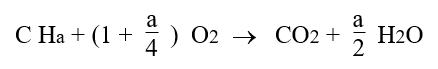
The complete combustion of a CHa formula fuel with pure oxygen would be governed by the equation below: it takes 1 oxygen molecule to form CO2, and a/4 oxygen molecules to form a/2 H2O.
However, in energy systems, combustion is almost always made with air as an oxidizer.
Since dry air is approximately 79% nitrogen and 21% oxygen, the nitrogen/oxygen ratio is 79/21 = 3.762.
That's why the air can be represented by O2 + 3.762 N2.
The complete combustion with air of a CHa formula fuel is therefore governed by the equation below:
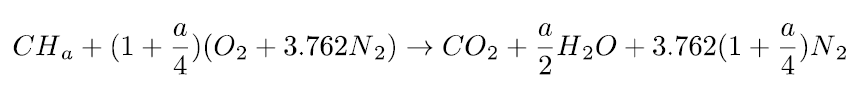
It is the one that leads to the highest end-of-combustion temperature. We will consider it as a reference combustion.
These equations mean that the stoichiometric combustion of a CHa fuel mole requires (1 + a/4) oxygen moles and produces 1 mole of carbon dioxide and a/2 moles of water.
If the oxidizer is air, 3.762 (1 + a/4) moles of nitrogen are also involved, but because they do not react with the fuel, they end up in the burnt gases. Nitrogen is said to remain inert.
When the combustion is not stoichiometric, it can be defined in several ways:
Either by excess air e, which as the name suggests, represents the amount of excess air
Or by the air factor lambda, which is equal to 1 + excess air
Either by the R richness, ratio of the number of moles (or mass) of fuel contained in a specified amount of mixture, to the number of moles (or mass) of fuel in the stoichiometric mixture.
We will use lambda preferentially in the following, because that is the air multiplier factor in the combustion equation.
In gas turbines, the need to protect the expansion blades against corrosion and mechanical creep leads to limiting the end of combustion temperature to values much lower than those that a stoichiometric combustion would allow one to reach.
Combustion therefore takes place with a large excess of air.
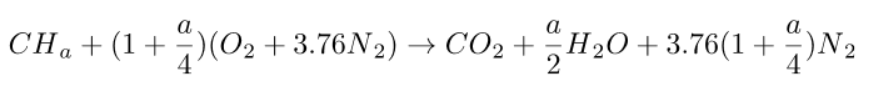
The equation which governs the complete combustion of a fuel of formula CHa is written under these conditions for so-called “atmospheric” air as follows, lambda being the air factor. Note that there is a small difference from the equations above, with the number of nitrogen moles per oxygen mole in atmospheric air being taken at 3.76 and not 3.762.
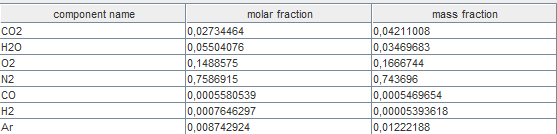
This small calculator allows you to study the influence of a and lambda on this equation. The table below shows you the number of moles of the products and their total, how the molar fractions are calculated, and their values for the chosen setting.You can test the two oxidizers used previously, oxygen or atmospheric air.
If this calculator doesn't open in your Thermoptim browser, you can access it via this link: https://thopt.s4e2.com:8443/CalcCombInitFr/index.jsp
In this example, we will assume that the fuel is methane, of composition CH4.
The previous equation simplifies and becomes:

It suffices to replace lambda by its value.
Loading the model
Loading the model is done by opening the diagram file and a properly
configured project file.
Start by loading the model, then complete the other suggested
activities.
Load the model
Click on the following link: Open a file in Thermoptim
You can also:
- either open the "Project files/Example catalog" (CtrlE) and select model m4.1 in Chapter 4 model list.
- or directly open the diagram file (GT_comb.dia) using the “File
/ Open” menu in the diagram editor menu, and the project file
(GT_comb.prj) using the “Project file / Load a project
”from the simulator menu.
Show diagram editor
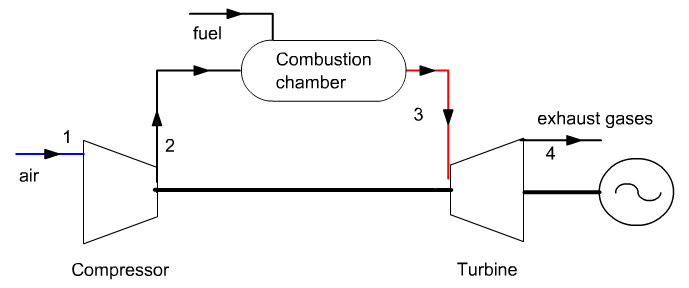
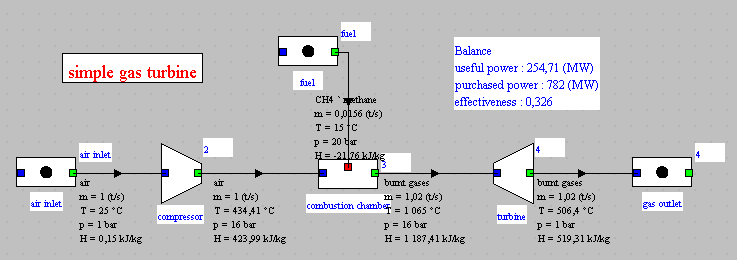
The model appears in the diagram editor.
We find the air inlet, the compressor, the combustion chamber, to
which is connected a process entitled "fuel", and the expansion
turbine.
The names of the three substances involved in the model are air,
methane (CH4 'methane), and fumes (gas_burned).
Setting of the "combustion chamber" process
Double-click on the "combustion chamber" process.
If you are unable to do so, click this button
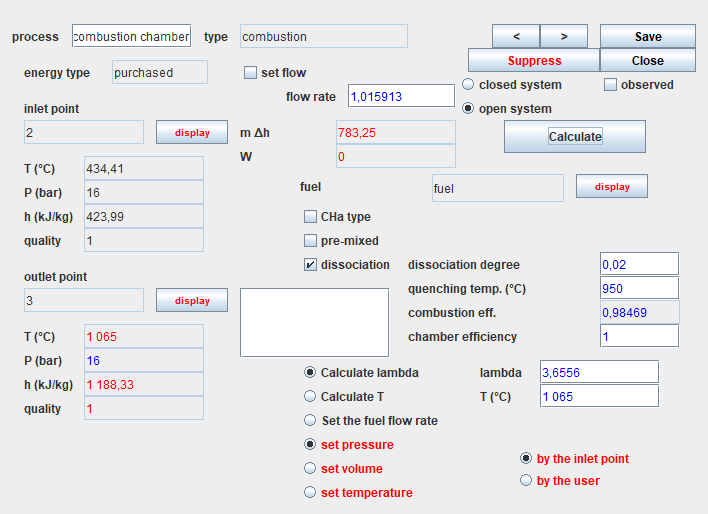
Here is the screen of the combustion chamber.
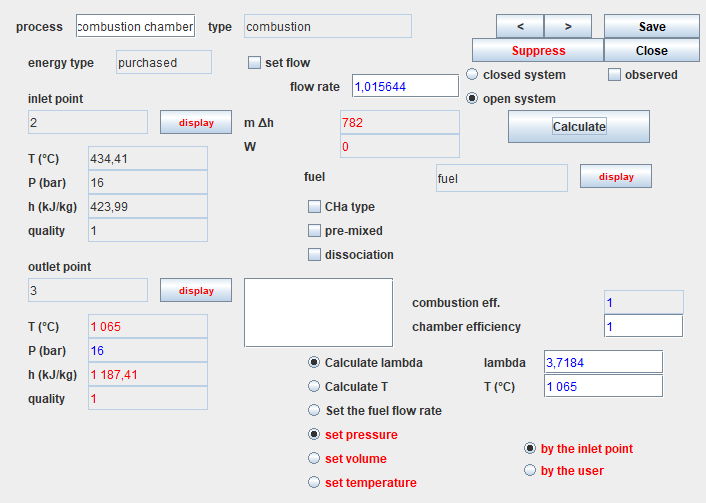
It is connected to the "fuel" process as we have seen in the diagram editor.
The option "Calculate lambda" is selected, and the value of the end of combustion temperature has been entered in the field labeled "T (° C)": 1065 ° C.
The options "set pressure" and "by the upstream point" are selected,
which means that the downstream point "3" pressure will be equal to
that of the upstream point "2", ie 16 bar.
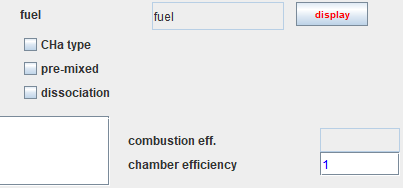
The efficiency of the combustion chamber is equal to 1, which means
that it is not cooled: all the energy released by the combustion is
used to heat the burnt gases.
Finally, the "dissociation" option is not selected, which means that
the combustion is complete: there will be no unburnt gas in the fumes.
Once the process has been calculated, the results obtained are as
follows:
- the lambda flow factor is calculated (3.7184)
- the fuel flow is determined and updated in the corresponding process, and the total flow appears in the combustion chamber screen (1.015644 kg / s)
- the energy released by the fuel is calculated and displayed (782 kW)
- the composition of the downstream point is determined. To display it, you have to go to the screen of this point and click on the "display" button located to the right of the substance name.
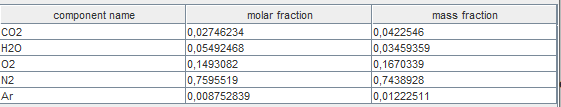
It is easy to verify that this composition is that given by the methane combustion equation, using the small calculator on the previous page.
It is enough to replace lambda with its value, the decimal separator being the point.
The values provided by Thermoptim are slightly different due to the presence of argon in the air, whereas the previous equation did not include any, this gas being counted in nitrogen.
Comparison with the initial model without combustion
Let us now study the changes brought about by taking into account the combustion reaction.The figure below shows the synoptic view of the initial model where the combustion chamber was replaced by an "exchange" process.
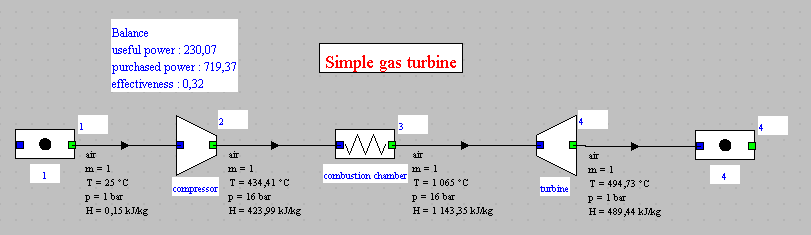
We note that the efficeiencies are roughly the same: 32% for the
initial cycle, and 32.57% for the new one, ie a difference of less
than 2%.
The useful power output was 230 kW while it is 255 kW with the
combustion chamber, which represents an increase of almost 11%.
How can we explain such a difference ?
- first, the flow through the turbine has increased by 1.56%
- if we look at the power produced by the turbine, it goes from 654 kW to 678.6, an increase of 3.8%, which is far from the account
- everything is explained, however, if we remember that nearly two-thirds of the power produced by the turbine is used to drive the compressor. A gain of 3.8% on the power produced thus translates into an increase of 10.8% on the net power.
Plot of the cycle in the (h, ln (P)) chart
First step: loading the flue gas (h, ln (P)) chart
However, for reasons that we will give later, we will use the (h, ln (P)) chart of the fumes, the substance of which is called "gas_burned".
Click this button
You can also open the chart using the line “Interactive charts” of
the “Special” menu of the simulator screen, which opens an interface
that links the simulator and the charts. Double-click in the field
located at the top left of this interface to choose the type of
chart desired (here “Ideal gases”).
Once the chart is open, select “(h, p)” in the “Chart” menu, and
click on the line “Load a gas from the base” in the Gas Editor menu,
and choose “burnt_gas” among the Protected compound gases.
If you do not have access to the gas turbine (h, P) charts, open
the Help / Global settings menu in the Thermoptim simulator screen,
check the "(h, P) char for gas " at the bottom on the left, then
close the window by clicking on "OK".
Restart Thermoptim. (h, P) charts should be displayable.
If the window is displayed correctly, but without showing the
iso-value lines of the chart, it is undoubtedly that the display
interval of the values is not the right one, because of the
previous settings.
It is possible to modify the calculation and display values by
adjusting the parameters in the chart menus:
- Open the Chart / X Axis menu line, then enter a minimum of -50 and a maximum of 1450 to define the enthalpy values to be displayed
- Open the Chart / Y axis menu line, then enter a minimum of 1 and a maximum of 32 to define the pressure values to be displayed
- If the iso-values lines are not the correct ones, open the Chart / parameters menu line, then enter the following values to define the iso-values to display:
- Temperatures between -50°C and 1150°C
- Pressures between 1 and 32 bar
Second step: loading a pre-recorded cycle corresponding to the
loaded project, the layout of which has been refined beforehand to be
more precise
Click this button
Repeat the operation for the cycle corresponding to the old model, whose file is "GT_light_25Thin.txt".
The two cycles appear superimposed on the chart.
To differentiate them, operate as follows.
Open the cycle manager screen (menu Cycles / Cycle manager)
Click on "Update the cycle table"
Select the line "cycle without combustion"
In the upper right part of the screen, select the line of the pop-up menu showing dots
Then resize the chart window very slightly. The initial cycle appears in dotted lines, as in the image below.
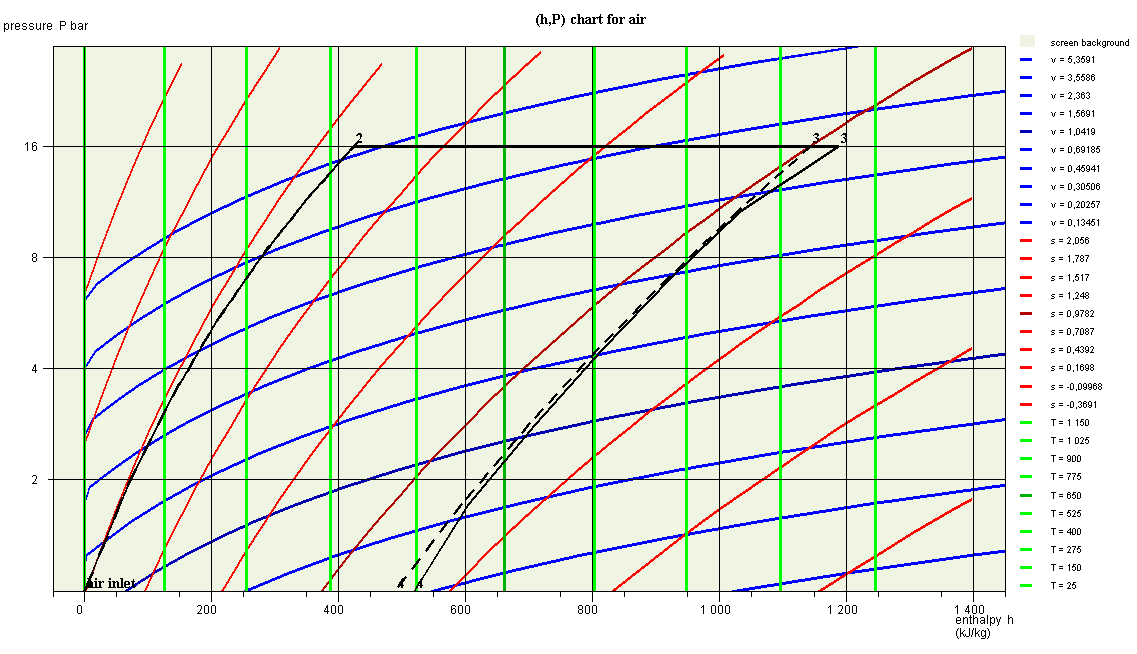
The two cycles are superimposed for the phases of compression (1-2) and heating (2-3), but the two points 3 are shifted, which is surprising at first glance.
This is because their enthalpies are different, even though their pressure and temperature are the same.
We have represented the two cycles in a single chart, but, strictly speaking, we are not allowed to do so for the cycle with combustion chamber, since points 1 and 2 do not correspond to the same fluid as points 3 and 4.
Plot of the cycle in the (T, s) entropy chart
You can, if you wish, see what becomes of the plot of these two
cycles in the entropy chart.
All you have to do is activate line (T, s) in the Chart menu.
The chart that appears corresponds to the image below.
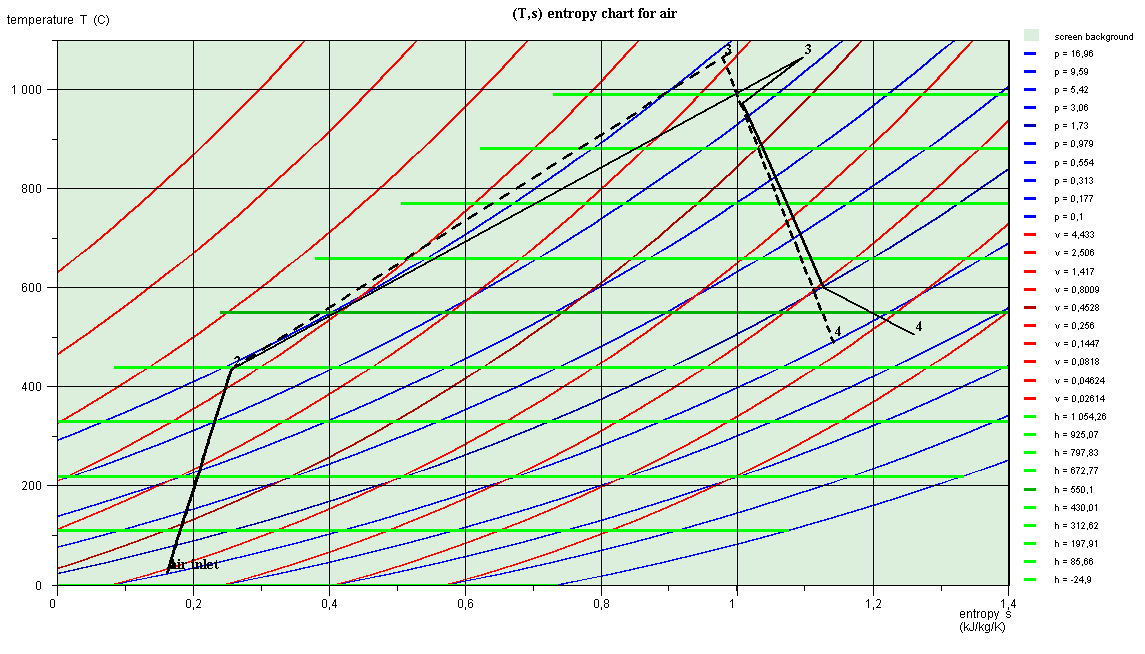
Points 3 are at the same temperature, but their entropies are
different, which explains why they do not have the same abscissa.
The curve (2-3) of the heating in the combustion chamber has no
physical meaning, due to the change in the composition of the working
fluid.
This is why it does not follow the isobar P = 16 bar.
This disturbed plot comes, as we have said, from the fact that we
should not strictly represent this cycle in a chart relating to a
single fluid.
If we had displayed the cycles in the air chart, the curves (2-3) and
(3-4) would be even further removed from reality.
Taking into account dissociation
Let us recall the screen of the combustion chamber, whose specific
settings appear in the lower right part.
If we consider that the combustion reaction is not complete, it is possible to take into account the dissociation of part of the CO2 into CO and O2.
Here is what you get.
But above all, the combustion efficiency is no longer equal to 1. It
has dropped a little because of the presence of unburnt gas.
If you display the new smoke composition, here is the result.
If you look at the overall efficiency of the gas turbine set in this
way, you will see that it has increased very slightly, which may seem
paradoxical because there are unburnt gases.
The reason is that the balance calculated by Thermoptim does not take
into account the LHV lost by the fumes.
It is determined by considering only the energy released by
combustion, excluding that which remains in the flue gases.
Conclusion
This exploration allowed you to discover how to set combustion in Thermoptim.Refer to volume 2 of the software package reference manual for all the possible settings of a combustion chamber.
It is that which is taken into account in the equation corresponding to the law of mass action.
We will assume that it is 950 ° C.
We must also enter the value of the dissociation rate, which we will assume to be 0.02, that is to say 2%.
Then recalculate the "combustion chamber" process.